9. Installation
This chapter describes the installation steps for the Smart Emission Data Platform in a regular Docker environment. Note that installation and maintenance on Kubernetes is described in the :ref:`kubernetes`_ (K8s) chapter.
Currently http://test.smartemission.nl runs in this regular Docker environment, while the SE production http://data.smartemission.nl runs on K8s.
9.1. Principles
These are requirements and principles to understand and install an instance of the SE platform. It is required to have an understanding of Docker, as that is the main environment in which the SE Platform is run.
- Required OS: Ubuntu Linux 14.04 or later (tested on 14.04 and 16.04)
- all components are Docker Images run as Docker Containers (with exception cAdvisor on Ubuntu 14.04)
- all required code comes from GitHub: https://github.com/smartemission/smartemission
- all dynamic data: settings, databases, logfiles, website, ETL scripts is maintained on the host system (via Docker container Volume-mapping)
- Docker images are connected and networked via Docker Link (
--link) mapping - all access to application services containers (GeoServer, SOS, Grafana etc) is proxied via the Apache2 web Docker container
- settings per-system, like passwords and other settings, are kept in per-host
etl/options/<yourhostname>.args(see below) - dynamic data (databases, logs, backups) is maintained under
/var/smartem. - a single
bootstrap.shscript will installDockerplus other required packages (optional, see below) - all ETL/calibration processes run as scheduled
cronjobs - all ETL Processes use a single Docker Image that embeds the Stetl ETL Tool
- maintain ETL functionality in GitHub and just refresh/pull GitHub dir on server (no need for rebuilding Docker)
- backups for all configuration and databases is scheduled each midnight
9.2. Security
Dependent on local requirements and context (e.g. firewall already in place) install basic security tools.
Basics: https://www.thefanclub.co.za/how-to/how-secure-ubuntu-1604-lts-server-part-1-basics
9.2.1. UFW Uncomplicated Firewall
https://help.ubuntu.com/16.04/serverguide/firewall.html Install UFW and enable, open a terminal window and enter :
    apt-get install ufw
    ufw allow ssh
    ufw allow http
    ufw allow https

    # Enable the firewall.
    ufw enable
shutdown -r now

    # Check the status of the firewall.
    ufw status verbose

    Status: active
    Logging: on (low)
    Default: deny (incoming), allow (outgoing), disabled (routed)
    New profiles: skip

    To                         Action      From
    --                         ------      ----
    22                         ALLOW IN    Anywhere
    80                         ALLOW IN    Anywhere
    443                        ALLOW IN    Anywhere
    1883                       ALLOW IN    Anywhere
    8086                       ALLOW IN    Anywhere
    22 (v6)                    ALLOW IN    Anywhere (v6)
    80 (v6)                    ALLOW IN    Anywhere (v6)
    443 (v6)                   ALLOW IN    Anywhere (v6)
    1883 (v6)                  ALLOW IN    Anywhere (v6)
    8086 (v6)                  ALLOW IN    Anywhere (v6)
9.2.2. fail2ban
See https://www.digitalocean.com/community/tutorials/how-to-install-and-use-fail2ban-on-ubuntu-14-04. And: https://www.thefanclub.co.za/how-to/how-secure-ubuntu-1604-lts-server-part-1-basics
    apt-get install -y fail2ban

cp /etc/fail2ban/jail.conf /etc/fail2ban/jail.local

# Maak config in /etc/fail2ban/jail.local

# EXAMPLE
    # See jail.conf(5) man page for more information
    [sshd]

    enabled  = true
    port     = ssh
    filter   = sshd
    logpath  = /var/log/auth.log
    maxretry = 3

    [DEFAULT]

    # "bantime" is the number of seconds that a host is banned.
    # bantime  = 600
    bantime  = 604800

    # A host is banned if it has generated "maxretry" during the last "findtime"
    # seconds.
    # findtime  = 600
    findtime = 900

    # "maxretry" is the number of failures before a host get banned.
    maxretry = 5
9.3. Installation
There are just a few commands to install and initialize the entire SE Platform.
To install the entire platform on a bare Ubuntu Linux on an empty Virtual Machine (VM),
make all databases ready and run/schedule (cron) all processes can be done within 15-30 minutes.
On an empty Ubuntu Linux system perform all the steps below in that order as user root.
9.3.1. Get Bootstrap Script
Get the SE Platform bootstrap.sh script:
# In e.g. home dir
$ apt-get install curl
$ curl -O https://raw.githubusercontent.com/smartemission/smartemission/master/platform/bootstrap.sh
Get the SE Platform bootstrap-nodocker.sh script:
# In e.g. home dir
$ apt-get install curl
$ curl -O https://raw.githubusercontent.com/smartemission/smartemission/master/platform/bootstrap.sh
9.3.2. Install and Build
Within this dir do the following steps to install packages and SE-code (from GitHub) and build Docker images:
# become root if not already
$ sudo su  -

# OPTIONAL
# Install Docker and required packages
# plus checkout (Git) all SE code from GitHub
# Confirm interactive choices: postfix "Local".
$ ./bootstrap.sh

# go platform home dir:
$ cd /opt/geonovum/smartem/git/platform

# Tip: make dynamic link to quickly access GitHub code dir from ~/git
cd
ln -s /opt/geonovum/smartem/git git

# build all Docker images (be patient)
$ ./build.sh
9.3.3. Configure
Next configure and install databases and ETL-options. First make your own host-dependent configuration file as a copy from example.args:
# Go to config options dir
$ cd /opt/geonovum/smartem/git/etl/options

# Note your machine's hostname, symbolically "yourhostname"
$ hostname
yourhostname

# Make copy of the example config file
# NB never put this file in GitHub or public dir!!
$ cp example.args  yourhostname.args

# Change the config values for your local situation
$ vi yourhostname.args

# Create a HTTP admin password file named 'htpasswd' See README.TXT there.
cd /opt/geonovum/smartem/git/services/web/config/admin
htpasswd htpasswd <username>
9.3.4. Create Databases
Now create and initialize all databases (PostGIS and InfluxDb):
# Creates and initializes all databases
# NB WILL DESTROY ANY EXISTING DATA!!
./init-databases.sh
9.3.5. Load Calibration Data
Mainly ANN models stored in PostGIS. For example get latest data from production:
scp root@test.smartemission.nl:/var/smartem/backup/gis-smartem_calibrated.dmp /var/smartem/backup/
cd /opt/geonovum/smartem/git/platform
./restore-db.sh /var/smartem/backup/gis-smartem_calibrated.dmp
9.3.6. Install System Service
The entire platform (all Docker Images and cron jobs) can be started/stopped with single system service command smartem :
# Installs Linux system service "smartem" in /etc/init.d
./install.sh

# Test (see Running below)
service smartem status

# in browser: go to http://<yourdomain>/geoserver and
# change GeoServer default password (admin, geoserver)
9.4. Running
The entire SE-platform (all Docker Images and cron jobs) can be started/stopped/inspected via Linux “service smartem” commands:
service smartem status
service smarted stop
service smartem start
etc or even /etc/init.d/smartem start|stop|status will work.
The link http://data.smartemission.nl/adm gives access to admin pages.
Checking status:
$ service smartem status
* Checking status of Smart Emission Data Platform smartem                                                                                                                         CONTAINER ID        IMAGE                      COMMAND                  CREATED             STATUS              PORTS                                            NAMES
938924fff0a3        geonovum/stetl:latest      "/usr/local/bin/st..."   20 seconds ago      Up 19 seconds                                                        stetl_sospublish
dd598dbd1e0f        geonovum/apache2           "/usr/bin/supervisord"   3 weeks ago         Up 3 weeks          22/tcp, 0.0.0.0:80->80/tcp                       web
2dcd2b91a7a1        grafana/grafana:4.1.1      "/run.sh"                3 weeks ago         Up 3 weeks          0.0.0.0:3000->3000/tcp                           grafana
573c839c7bab        geonovum/sos52n:4.3.7      "catalina.sh run"        3 weeks ago         Up 3 weeks          8080/tcp                                         sos52n
aa16f2e456f6        geonovum/geoserver:2.9.0   "catalina.sh run"        3 weeks ago         Up 3 weeks          8080/tcp                                         geoserver
f915fc5d1d2b        influxdb:1.1.1             "/entrypoint.sh -c..."   3 weeks ago         Up 2 weeks          0.0.0.0:8083->8083/tcp, 0.0.0.0:8086->8086/tcp   influxdb
08b5decd0123        geonovum/postgis:9.4-2.1   "/bin/sh -c /start..."   3 weeks ago         Up 3 weeks          5432/tcp                                         postgis

# List cronjobs
$ crontab -l
9.4.1. Handy Commands
Some handy Docker commands:
# cleanup non-running images
$ sudo docker rm -v $(sudo docker ps -a -q -f status=exited)
$ sudo docker rmi $(sudo docker images -f "dangling=true" -q)

# go into docker image named apache2 to bash prompt
sudo docker exec -it apache2 bash

# Find local Docker Bridge address of running container
docker inspect --format '{{ .NetworkSettings.Networks.se_back.IPAddress }}' postgis
# Example: psql to local postgis container
psql -h `docker inspect --format '{{ .NetworkSettings.Networks.se_back.IPAddress }}' postgis` -U docker -W gis
9.5. Docker Containers
Below the Docker Containers: how their generic Docker Images are built/acquired and how they are run using local mappings, data and configs.
Each Docker image build is found under /docker in GitHub. Docker Containers
are run via subdirs under services.
9.5.1. postgis - PostGIS Database
Uses PostGIS Docker image from Kartoza (Tim Sutton, QGIS lead), see https://hub.docker.com/r/kartoza/postgis/ and https://github.com/kartoza/docker-postgis .
This shorthand script run.sh will (re)run the postgis container.
#!/bin/bash
#
# Run the Postgresql server with PostGIS and default database "gis".
#

# Stop and remove possibly old containers
docker-compose stop
docker-compose rm -f

# Finally run
docker-compose up -d

# TIP to connect from host to postgis container
# psql -h `sudo docker inspect --format '{{ .NetworkSettings.Networks.se_back.IPAddress }}' postgis` -U docker -W gis
To connect with psql from host using PG client package on host:
# sudo apt-get install postgresql-client-9.3
psql -h `docker inspect --format '{{ .NetworkSettings.Networks.se_back.IPAddress }}' postgis` -U docker -W -l

Password for user docker:
                                 List of databases
       Name       |  Owner   | Encoding  | Collate | Ctype |   Access privileges
------------------+----------+-----------+---------+-------+-----------------------
 gis              | docker   | UTF8      | C       | C     |
 postgres         | postgres | SQL_ASCII | C       | C     |
 template0        | postgres | SQL_ASCII | C       | C     | =c/postgres          +
                  |          |           |         |       | postgres=CTc/postgres
 template1        | postgres | SQL_ASCII | C       | C     | =c/postgres          +
                  |          |           |         |       | postgres=CTc/postgres
 template_postgis | postgres | UTF8      | C       | C     |
(5 rows)
9.5.2. stetl - ETL for Measurements
Uses the geonovum/stetl image with Stetl config from GitHub for all ETL processes.
# build stetl image
cd ~/git/docker/stetl
sudo docker build -t smartemission/stetl .

# run last measurements ETL, linking to postgis image
cd ~/git/etl
./last.sh

# before first run do ./db-init.sh to create DB schema and tables
The last.sh script is a wrapper to run the generic Docker geonovum/stetl with our
local ETL-config and PostGIS:
#!/bin/bash
#
# ETL to harvest and refine last values of sensor data from Data Collectors.
#

./run.sh last
9.5.3. webapps - Web Containers
Each webapp has its own Docker image and is started via docker-compose.
version: "3"

services:

  home:

    image: smartemission/se-home:1.0.1

    container_name: home

    restart: unless-stopped

    labels:
      - "traefik.backend=home"
      - "traefik.enable=true"
      - "traefik.frontend.priority=5"
      - "traefik.frontend.rule=PathPrefixStrip:/"
      - "traefik.docker.network=se_back"

    networks:
      - se_back

#    ports:
#      - 80:80

networks:
  se_back:
    external: true
9.5.4. geoserver - GeoServer
GeoServer is run from a Docker image based on Kartoza’s GeoServer Dockerfile: https://github.com/kartoza/docker-geoserver/blob/master/Dockerfile. This Dockerfile is very versatile, as it allows to tune Tomcat parameters and add GeoServer plugins.
Some local modifications were required, thus a customized Docker image geonovum/geoserver
has been developed. See https://github.com/smartemission/smartemission/tree/master/docker/geoserver.
GeoServer can then be run with the bash-script: https://github.com/smartemission/smartemission/blob/master/services/geoserver/run.sh
This script maps the local directory /var/smartem/data/geoserver as the GeoServer data-dir, thus
keeping it outside the Docker container. Also the mapping is provided to the PostGIS Docker container
postgis, thus PostGIS Stores within the GeoServer config can be accessed using the CNAME Host postgis.
GeoServer is accessed via the web container via the AJP Apache2 proxy (port 8009).
9.5.5. sos - 52North SOS
Similar to GeoServer: Tomcat with .war file and keeping config outside Docker container
and mapping DB to postgis container.
See https://github.com/smartemission/smartemission/tree/master/docker/sos52n.
This service configures and runs an OGC SOS server using a Docker Image that embeds the 52North SOS Server.
9.5.5.1. Setup (Once)
- Setup PG database schema once using config/sos-clear.sh.
- SOS (server): config/settings.json.
- jsclient (viewer): config/jsclient/settings.json.
A sqlite DB contains all settings that can be managed via the GUI and is best copied from a previous configured SOS instance in /var/smartem/data/sos52n/configuration.db. On the first start this dir will be created and linked using Docker volume mapping.
9.5.6. gost - Geodan STA
This runs the Geodan GOST SensorThings API server. See the README there. Be sure to first create the PostGIS DB schema for GOST.
See the bash-script how to run (no Docker-compose used!): https://github.com/smartemission/smartemission/blob/master/services/gost/run.sh .
9.5.7. influxdb - InfluxDB
This runs the InfluxDB service as a Docker container. See https://www.influxdata.com:
InfluxDB is an open source database written in Go specifically to handle time series data with high availability and high performance requirements. InfluxDB installs in minutes without external dependencies, yet is flexible and scalable enough for complex deployments.
The Docker image comes from https://hub.docker.com/_/influxdb/
See https://github.com/smartemission/smartemission/tree/master/services/influxdb.
To be supplied further.
9.5.8. chronograf - Chronograf
This runs the Chronograf service as a Docker container. Chronograf is a visual admin tool for a.o. InfluxDB. See https://www.influxdata.com:
Chronograf is a visualization tool for time series data in InfluxDB.
The Docker image comes from https://hub.docker.com/_/chronograf/
See https://github.com/smartemission/smartemission/tree/master/services/chronograf.
Only accessible via SE Admin web UI. To be supplied further.
9.5.9. grafana - Grafana
From http://grafana.org
“Grafana is an open source metric analytics and visualization suite. It is most commonly used for visualizing time series data for infrastructure and application analytics but many use it in other domains including industrial sensors, home automation, weather, and process control.”
Watch the demo and be amazed: http://play.grafana.org Documentation: http://docs.grafana.org
See https://github.com/smartemission/smartemission/tree/master/services/grafana.
To be supplied further.
9.5.10. monitoring - Monitoring
Monitoring is based around Prometheus and a dedicated (for monitoring) Grafana instance. A complete monitoring stack is deployed via docker-compose based on the Docker Monitoring Project.
“Prometheus is an open-source systems monitoring and alerting toolkit originally built at SoundCloud. Since its inception in 2012, many companies and organizations have adopted Prometheus, and the project has a very active developer and user community. It is now a standalone open source project and maintained independently of any company. To emphasize this, and to clarify the project’s governance structure, Prometheus joined the Cloud Native Computing Foundation in 2016 as the second hosted project, after Kubernetes.”
Documentation: https://prometheus.io/docs/ . Howto: https://medium.com/@soumyadipde/monitoring-in-docker-stacks-its-that-easy-with-prometheus-5d71c1042443
See https://github.com/smartemission/smartemission/tree/master/services/monitoring.
The compose file is as follows:
# Adapted from Brian Christner's: https://github.com/vegasbrianc/prometheus
# and later: https://github.com/vegasbrianc/docker-pulls/blob/master/docker-compose.yml
# All credits there!
# Taken version-2 branch on dec 18, 2017.
#
# Changes by Just van den Broecke:
# - removed Docker Swarm stuff (why needed?)
# - removed port mappings (prevent outside access)
# - run on local bridge network  (network_mode: bridge, as to be proxied from Apache web container)

version: '3.1'

volumes:
    prometheus_data: {}
    grafana_data: {}

services:

  node-exporter:
    # See https://github.com/vegasbrianc/docker-pulls/blob/master/docker-compose.yml
    image: prom/node-exporter
    container_name: node-exporter
    volumes:
      - /proc:/host/proc:ro
      - /sys:/host/sys:ro
      - /:/rootfs:ro
    command:
      - '--path.procfs=/host/proc'
      - '--path.sysfs=/host/sys'
      - --collector.filesystem.ignored-mount-points
      - "^/(sys|proc|dev|host|etc|rootfs/var/lib/docker/containers|rootfs/var/lib/docker/overlay2|rootfs/run/docker/netns|rootfs/var/lib/docker/aufs)($$|/)"
#      - '--collector.textfile.directory /etc/node-exporter/'
#    ports:
#      - 9100:9100
    networks:
      - se_back
    restart: unless-stopped

  cadvisor:
    # image: google/cadvisor
    image: smartemission/se-cadvisor:v0.28.3
    container_name: cadvisor
    volumes:
     - /:/rootfs:ro
     - /var/run:/var/run:rw
     - /sys:/sys:ro
     - /var/lib/docker/:/var/lib/docker:ro
    #    ports:
    #      - 8080:8080
    command:
      - '--port=8081'
    networks:
      - se_back
    restart: unless-stopped

  prometheus:
    # image: prom/prometheus:v2.0.0
    image: prom/prometheus:v2.2.1
    container_name: prometheus
    depends_on:
      - cadvisor
      - node-exporter
    labels:
      - "traefik.backend=prometheus"
      - "traefik.enable=true"
      - "traefik.frontend.priority=600"
      - "traefik.frontend.rule=Method:GET"
      - "traefik.frontend.rule=PathPrefix:/adm/prometheus"
      # - "traefik.frontend.auth.basic=sadmin:$$apr1$$gVo/HcPx$$2AudzGfyX7Xxg7aD/b1zf."
      - "traefik.docker.network=se_back"
    volumes:
      - ./prometheus/:/etc/prometheus/
      - prometheus_data:/prometheus
    command:
      - '--config.file=/etc/prometheus/prometheus-gen.yml'
      - '--storage.tsdb.path=/prometheus'
      - '--web.console.libraries=/usr/share/prometheus/console_libraries'
      - '--web.console.templates=/usr/share/prometheus/consoles'
      - "--web.external-url=http://${se_host}${se_port}/adm/prometheus"

     # - '--storage.tsdb.retention=200h'
     # - '--web.route-prefix=/prometheus'

#    ports:
#      - 9090:9090
#    links:
#      # - cadvisor:cadvisor
#      # - node-exporter:node-exporter
#      - alertmanager:alertmanager

    networks:
      # Visible in SE backend and frontend Docker network
      - se_back
    restart: unless-stopped

  grafana:
    image: grafana/grafana:5.1.3
    container_name: grafanamon
    depends_on:
      - prometheus
    environment:
      - GF_SERVER_ROOT_URL=%(protocol)s://%(domain)s:%(http_port)s/adm/grafanamon
      - GF_AUTH_ANONYMOUS_ENABLED=true
    labels:
      - "traefik.backend=grafanamon"
      - "traefik.enable=true"
      - "traefik.frontend.priority=600"
      - "traefik.frontend.rule=Method:GET"
      - "traefik.frontend.rule=PathPrefixStrip:/adm/grafanamon"
      # - "traefik.frontend.auth.basic=sadmin:$$apr1$$gVo/HcPx$$2AudzGfyX7Xxg7aD/b1zf."
      - "traefik.docker.network=se_back"

#    links:
#      - prometheus:prometheus
#    ports:
#      - 3000:3000

    volumes:
      - ./grafana/provisioning:/etc/grafana/provisioning:ro
      # - grafana_data:/var/lib/grafana
    env_file:
      - grafana/grafana.conf
    networks:
      # Visible in SE backend and frontend Docker network
      - se_back


  alertmanager:
    image: prom/alertmanager
    container_name: alertmanager
#    ports:
#      - 9093:9093
    volumes:
      - ./alertmanager/:/etc/alertmanager/
    networks:
      # Visible in SE backend and frontend Docker network
      - se_back
    restart: unless-stopped
    command:
      - '--config.file=/etc/alertmanager/config-gen.yml'
      - '--storage.path=/alertmanager'


networks:
  se_back:
    external: true
This compose file is attached to the default Docker bridge network. The following Docker images are deployed via the compose file:
9.5.10.1. Prometheus
Using Prometheus 2.0+. Configuration in prometheus.yml :
# my global config
global:
  scrape_interval:     15s # By default, scrape targets every 15 seconds.
  evaluation_interval: 15s # By default, scrape targets every 15 seconds.
  # scrape_timeout is set to the global default (10s).

  # Attach these labels to any time series or alerts when communicating with
  # external systems (federation, remote storage, Alertmanager).
  external_labels:
      monitor: 'smart-emission'

# Load and evaluate rules in this file every 'evaluation_interval' seconds.
rule_files:
  - 'alert.rules'
  # - "first.rules"
  # - "second.rules"

# alert
alerting:
  alertmanagers:
  - scheme: http
    static_configs:
    - targets:
      - "alertmanager:9093"

# A scrape configuration containing exactly one endpoint to scrape:
# Here it's Prometheus itself.
scrape_configs:
  # The job name is added as a label `job=<job_name>` to any timeseries scraped from this config.
  - job_name: 'prometheus'
    scrape_interval: 5s
    honor_labels: true
    metrics_path: '/adm/prometheus/metrics'
    static_configs:
      - targets: ['localhost:9090']

  - job_name: 'node'

    # Override the global default and scrape targets from this job every 5 seconds.
    scrape_interval: 5s

    # metrics_path defaults to '/metrics'
    # scheme defaults to 'http'.

    static_configs:
      - targets: ['$CADVISOR_HOST:8081','$NODE_EXPORTER_HOST:9100']
Secure and pass via Apache proxy:
<Location /adm/prometheus>
  ProxyPreserveHost On
  ProxyPass http://monitoring_prometheus_1:9090/adm/prometheus
  ProxyPassReverse http://monitoring_prometheus_1:9090/adm/prometheus
  RequestHeader unset Authorization
</Location>
9.5.10.2. Grafana
Installed via docker-compose.
Secure and pass via Apache proxy:
<Location /adm/grafanamon>
    ProxyPreserveHost On
    ProxyPass http://monitoring_grafana_1:3000
    ProxyPassReverse http://monitoring_grafana_1:3000
    RequestHeader unset Authorization
</Location>
Add Prometheus with url http://prometheus:9090/adm/prometheus as DataSource with access proxy.
Import Dashboard 1860: https://grafana.com/dashboards/1860 to view Node Exporter stats. and 179: https://grafana.com/dashboards/179 to view Docker stats. Locally adapted versions of these are available under the /dashboards dir. Use the <name>-SE.json versions.
Alternative: https://github.com/stefanprodan/dockprom
9.5.10.3. cAdvisor
Used for getting metrics in Prometheus from Docker components. See https://github.com/google/cadvisor :
“cAdvisor (Container Advisor) provides container users an understanding of the resource usage and performance characteristics of their running containers. It is a running daemon that collects, aggregates, processes, and exports information about running containers. Specifically, for each container it keeps resource isolation parameters, historical resource usage, histograms of complete historical resource usage and network statistics. This data is exported by container and machine-wide.”
NB for now cAdvisor needs to be built because of this bug. Once that is resolved we can use official Docker Image.
NB cAdvisor via Docker on Ubuntu 14.04 has a serious issue (like Node_exporter) and this issue, so needs to be installed on host.
On Ubuntu 16.04 we can use cAdvisor in Docker again. Steps:
# Step 1: Install latest go-lang (go-lang package version on 14.04 too old!)
# See https://github.com/golang/go/wiki/Ubuntu
$ add-apt-repository ppa:gophers/archive
$ apt update
$ apt-get install golang-1.9-go
$ ls  /usr/lib/go-1.9/bin
$ go  gofmt
$ export GOROOT=/usr/lib/go-1.9
$ export PATH=$GOROOT/bin:$PATH

# Step 2 cAdvisor build
# See https://github.com/google/cadvisor/blob/master/docs/development/build.md
$ mkdir /opt/cadvisor
$ cd /opt/cadvisor
$ export GOPATH=/opt/cadvisor
$ go get -d github.com/google/cadvisor
$ cd /opt/cadvisor/src/github.com/google/cadvisor
$ make build
$ make test  (fails somehow)
$ ./cadvisor -version
   cAdvisor version v0.28.3.2+9ffa37396f19cb (9ffa373)
$ ./cadvisor
# surf to host:8080

# Step 3: install supervisord
$ apt-get install supervisor
$ service supervisor status
   is running

# Step 4: cAdvisor as supervisrod process (conf)
# See https://github.com/google/cadvisor/issues/771#issuecomment-322725681

# Put in /etc/supervisor/conf.d/cadvisor.conf
[program:cadvisor]
directory=/opt/geonovum/smartem/git/services/monitoring/cadvisor
command=/opt/geonovum/smartem/git/services/monitoring/cadvisor/run.sh
autostart=true
autorestart=unexpected
redirect_stderr=true

# with /opt/geonovum/smartem/git/services/monitoring/cadvisor/run.sh
# NB ENV setting via supervisord did not work on this version, need supervisor 3.2
#!/bin/bash
#
export PARENT_HOST=`ip route show | grep docker0 | awk '{print \$9}'`
export GOROOT="/usr/lib/go-1.9"
export GOPATH="/opt/cadvisor/src/github.com/google/cadvisor"
export PATH="${GOPATH}:${GOROOT}/bin:${PATH}"

cd ${GOPATH}
./cadvisor -listen_ip ${PARENT_HOST} -port 8080

# run
$ service supervisor stop
$ service supervisor start
# Check via host port 8080 and:
$ ps -elf | grep cadvisor
   4 S.... 00:00:01 /opt/cadvisor/src/github.com/google/cadvisor/cadvisor -port 8080
9.5.10.4. Node Exporter
In Grafana import Dashboard 1860: https://grafana.com/dashboards/1860 to view Node Exporter stats.
Node Exporter can be installed on the host to gather Linux/Ubuntu metrics.
Steps to install in /usr/bin/node_exporter:
mkdir -p /var/smartem/prometheus/archive
cd /var/smartem/prometheus/archive
wget https://github.com/prometheus/node_exporter/releases/download/v0.15.2/node_exporter-0.15.2.linux-amd64.tar.gz
cd /var/smartem/prometheus
tar -xvzf archive/node_exporter-0.15.2.linux-amd64.tar.gz
ln -s /var/smartem/prometheus/node_exporter-0.15.2.linux-amd64/node_exporter /usr/bin
Run as service via /etc/init/node_exporter.conf and listen on IP-address docker0 (so metrics not exposed to world):
# Run node_exporter  - place in /etc/init/node_exporter.conf

start on startup

script
  /usr/bin/node_exporter --web.listen-address="`ip route show | grep docker0 | awk '{print \$9}'`:9100"
end script
Start/stop etc
service node_exporter start
service node_exporter status
Challenge is to access Node Exporter on host from within Prometheus Docker container. See http://phillbarber.blogspot.nl/2015/02/connect-docker-to-service-on-parent-host.html In run.sh for Apache2:
PARENT_HOST=`ip route show | grep docker0 | awk '{print \$9}'`
$ docker run -d --restart=always --add-host=parent-host:${PARENT_HOST} .... etc
Extend Apache2 config:
<Location /prom-node-metrics>
        ProxyPass http://parent-host:9100/metrics
        ProxyPassReverse http://parent-host:9100/metrics
</Location>
Add node config in prometheus.yml:
    - job_name: 'node'
scrape_interval: 15s
honor_labels: true
metrics_path: '/prom-node-metrics'
scheme: http
static_configs:
  - targets: ['test.smartemission.nl', 'data.smartemission.nl']
In Grafana import Dashboard 1860: https://grafana.com/dashboards/1860 to view Node Exporter stats.
NB Node Exporter via Docker is NOT used to gather Linux/Ubuntu metrics from the local host as this gave too many locking issues: https://github.com/smartemission/smartemission/issues/73
9.5.10.5. AlertManager
For emitting Prometheus alerts. Two configs required:
Alert rules in Prometheus alert.rules config:
groups:
- name: example
  rules:

  # Alert for any instance that is unreachable for >5 minutes.
  - alert: service_down
    expr: up == 0
    for: 2m
    labels:
      severity: page
    annotations:
      summary: "Instance {{ $labels.instance }} down"
      description: "{{ $labels.instance }} of job {{ $labels.job }} has been down for more than 2 minutes."

  - alert: high_load
    expr: node_load1 > 0.5
    for: 2m
    labels:
      severity: page
    annotations:
      summary: "Instance {{ $labels.instance }} under high load"
      description: "{{ $labels.instance }} of job {{ $labels.job }} is under high load."
And notification routing in AlertManager config.yml:
# See https://www.robustperception.io/sending-email-with-the-alertmanager-via-gmail/
route:
  group_by: [Alertname]
  # Send all notifications to me.
  receiver: email-me

receivers:
- name: email-me
  email_configs:
  - to: $GMAIL_ACCOUNT
    from: $GMAIL_ACCOUNT
    smarthost: smtp.gmail.com:587
    auth_username: "$GMAIL_ACCOUNT"
    auth_identity: "$GMAIL_ACCOUNT"
    auth_password: "$GMAIL_AUTH_TOKEN"

#route:
#    receiver: 'slack'
#
#receivers:
#    - name: 'slack'
#      slack_configs:
#          - send_resolved: true
#            username: '<username>'
#            channel: '#<channel-name>'
#            api_url: '<incomming-webhook-url>'
See also: https://www.robustperception.io/sending-email-with-the-alertmanager-via-gmail/
9.6. Local Install
You can also install the SE platform on your local system, preferably using VirtualBox and Vagrant. This is very handy for development and testing.
Docker can be run in various ways. On Linux it can be installed directly (see next). On Mac and Windows
Docker needs to be run within a VM itself. On these
platforms Docker Toolbox needs to be installed. This
basically installs a small (Linux) VM (with a boot2docker iso) that runs in VirtualBox.
Within this Linux VM the actual Docker Engine runs. A sort
of Matroska construction. Via local commandline tools like docker-machine and docker, Docker images
can be managed.
However, the above setup creates some hard-to-solve issues when combining Docker images and especially when trying to use local storage and networking. Also the setup will be different than the actual deployment on the Fiware platform. For these reasons we will run a local standard Ubuntu VM via VirtualBox. On this VM we will install Docker, run our Docker images etc. To facilitate working with VirtualBox VMs we will use Vagrant. Via Vagrant it is very easy to setup a “Ubuntu Box” and integrate this with the local environment. A further plus is that within the Ubuntu Box, the installation steps will (mostly) be identical to those on the Fiware platform.
9.6.1. Docker with Vagrant
The following steps are performed after having VirtualBox and Vagrant installed.
# Create a UbuntuBox
$ vagrant init ubuntu/trusty64
A `Vagrantfile` has been placed in this directory. You are now
ready to `vagrant up` your first virtual environment! Please read
the comments in the Vagrantfile as well as documentation on
`vagrantup.com` for more information on using Vagrant.
This creates a default Vagrantfile within the directory of execution, here with some mods for port mapping:
# -*- mode: ruby -*-
# vi: set ft=ruby :

# All Vagrant configuration is done below. The "2" in Vagrant.configure
# configures the configuration version (we support older styles for
# backwards compatibility). Please don't change it unless you know what
# you're doing.
Vagrant.configure(2) do |config|
  # The most common configuration options are documented and commented below.
  # For a complete reference, please see the online documentation at
  # https://docs.vagrantup.com.

  # Every Vagrant development environment requires a box. You can search for
  # boxes at https://atlas.hashicorp.com/search.
  config.vm.box = "ubuntu/trusty64"

  # Disable automatic box update checking. If you disable this, then
  # boxes will only be checked for updates when the user runs
  # `vagrant box outdated`. This is not recommended.
  # config.vm.box_check_update = false

  # Create a forwarded port mapping which allows access to a specific port
  # within the machine from a port on the host machine. In the example below,
  # accessing "localhost:8081" will access port 80 on the guest machine.
  config.vm.network "forwarded_port", guest: 80, host: 8081

  # Create a private network, which allows host-only access to the machine
  # using a specific IP.
  # config.vm.network "private_network", ip: "192.168.33.10"

  # Create a public network, which generally matched to bridged network.
  # Bridged networks make the machine appear as another physical device on
  # your network.
  # config.vm.network "public_network"

  # Share an additional folder to the guest VM. The first argument is
  # the path on the host to the actual folder. The second argument is
  # the path on the guest to mount the folder. And the optional third
  # argument is a set of non-required options.
  # config.vm.synced_folder "../data", "/vagrant_data"

  # Provider-specific configuration so you can fine-tune various
  # backing providers for Vagrant. These expose provider-specific options.
  # Example for VirtualBox:
  #
  # config.vm.provider "virtualbox" do |vb|
  #   # Display the VirtualBox GUI when booting the machine
  #   vb.gui = true
  #
  #   # Customize the amount of memory on the VM:
  #   vb.memory = "1024"
  # end
  #
  # View the documentation for the provider you are using for more
  # information on available options.

  # Define a Vagrant Push strategy for pushing to Atlas. Other push strategies
  # such as FTP and Heroku are also available. See the documentation at
  # https://docs.vagrantup.com/v2/push/atlas.html for more information.
  # config.push.define "atlas" do |push|
  #   push.app = "YOUR_ATLAS_USERNAME/YOUR_APPLICATION_NAME"
  # end

  # Enable provisioning with a shell script. Additional provisioners such as
  # Puppet, Chef, Ansible, Salt, and Docker are also available. Please see the
  # documentation for more information about their specific syntax and use.
  # config.vm.provision "shell", inline: <<-SHELL
  #   sudo apt-get update
  #   sudo apt-get install -y apache2
  # SHELL
end
Later we can modify Vagrantfile further, in particular to integrate with the local host (Mac/Windows)
environment, in particular with our directories (e.g. Dockerfiles from GitHub) and local ports (to test
web services). Next, we start up the Ubuntu Box (UB) with vagrant up:
$ vagrant up

Bringing machine 'default' up with 'virtualbox' provider...
==> default: Checking if box 'ubuntu/trusty64' is up to date...
==> default: Clearing any previously set forwarded ports...
==> default: Clearing any previously set network interfaces...
==> default: Preparing network interfaces based on configuration...
    default: Adapter 1: nat
==> default: Forwarding ports...
    default: 22 (guest) => 2222 (host) (adapter 1)
==> default: Booting VM...
==> default: Waiting for machine to boot. This may take a few minutes...
    default: SSH address: 127.0.0.1:2222
    default: SSH username: vagrant
    default: SSH auth method: private key
    default: Warning: Remote connection disconnect. Retrying...
    default: Warning: Remote connection disconnect. Retrying...
==> default: Machine booted and ready!
We see that SSH port 22 is mapped to localhost:2222. Login to the box:
ssh -p 2222 vagrant@localhost # password vagrant

# but easier is to use vagrant
vagrant ssh
Our local directory is also automatically mounted in the UB so we can have access to our development files (in GitHub):
vagrant@vagrant-ubuntu-trusty-64:~$ ls /vagrant/
contrib  data  doc  git  Vagrantfile

# and our Dockerfiles within GitHub
vagrant@vagrant-ubuntu-trusty-64:~$ ls /vagrant/git/docker
apache2  boot2docker-fw.sh  postgis  stetl
Within the UB we are on a standard Ubuntu commandline, running a general Ubuntu upgrade first:
$ sudo apt-get update
$ sudo apt-get -y upgrade
The next steps are standard Docker install (see next section below). After the setup is tested by building and running one of our Docker files. Getting access to our Dockerfiles is easy, for example:
sudo ln -s /vagrant/git ~/git
cd ~/git/docker/apache2
sudo docker build -t geonovum/apache2 .
Run and test:
sudo docker run -p 2222:22 -p 80:80 -t -i geonovum/apache2
Then access Apache from local system via localhost:8081.
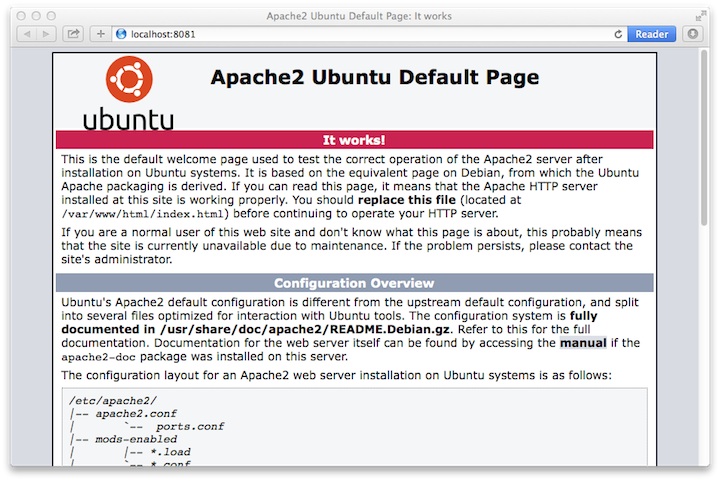
Access Apache running with Docker externally
Same for Stetl, build and test:
$ cd ~/git/docker/stetl
$ sudo docker build -t smartemission/stetl .
$ cd test/1_copystd
$ sudo docker run -v `pwd`:`pwd` -w `pwd`  -t -i geonovum/stetl -c etl.cfg

2016-04-22 19:09:29,705 util INFO Found cStringIO, good!
2016-04-22 19:09:29,774 util INFO Found lxml.etree, native XML parsing, fabulous!
2016-04-22 19:09:29,926 util INFO Found GDAL/OGR Python bindings, super!!
2016-04-22 19:09:29,952 main INFO Stetl version = 1.0.9rc3
2016-04-22 19:09:29,961 ETL INFO INIT - Stetl version is 1.0.9rc3
2016-04-22 19:09:29,965 ETL INFO Config/working dir = /home/vagrant/git/docker/stetl/test/1_copystd
2016-04-22 19:09:29,966 ETL INFO Reading config_file = etl.cfg
2016-04-22 19:09:29,968 ETL INFO START
2016-04-22 19:09:29,968 util INFO Timer start: total ETL
2016-04-22 19:09:29,969 chain INFO Assembling Chain: input_xml_file|output_std...
2016-04-22 19:09:29,987 input INFO cfg = {'class': 'inputs.fileinput.XmlFileInput', 'file_path': 'input/cities.xml'}
2016-04-22 19:09:29,993 fileinput INFO file_list=['input/cities.xml']
2016-04-22 19:09:29,995 output INFO cfg = {'class': 'outputs.standardoutput.StandardXmlOutput'}
2016-04-22 19:09:29,996 chain INFO Running Chain: input_xml_file|output_std
2016-04-22 19:09:29,996 fileinput INFO Read/parse for start for file=input/cities.xml....
2016-04-22 19:09:30,008 fileinput INFO Read/parse ok for file=input/cities.xml
2016-04-22 19:09:30,014 fileinput INFO all files done
<?xml version='1.0' encoding='utf-8'?>
<cities>
    <city>
        <name>Amsterdam</name>
        <lat>52.4</lat>
        <lon>4.9</lon>
    </city>
    <city>
        <name>Bonn</name>
        <lat>50.7</lat>
        <lon>7.1</lon>
    </city>
    <city>
        <name>Rome</name>
        <lat>41.9</lat>
        <lon>12.5</lon>
    </city>
</cities>

2016-04-22 19:09:30,024 chain INFO DONE - 1 rounds - chain=input_xml_file|output_std
2016-04-22 19:09:30,024 util INFO Timer end: total ETL time=0.0 sec
2016-04-22 19:09:30,026 ETL INFO ALL DONE
9.6.2. Running within 15 mins
Same steps as Installation above.