12. Administration
This chapter describes the daily operation and maintenance aspects for the Smart Emission platform (regular Docker environment). For example:
- how to start stop servers
- backup and restore
- managing the ETL
- where to find logfiles
- troubleshooting
- monitoring
12.1. Backup
Backup is automated: see Platform cronfile.txt and the backup.sh script.
Only dynamic data is backed-up as all code is in GitHub and the entire platform can be rebuild in minutes.
The last 7 days of data are backed-up by weekday (1 is monday), and then the last day of
each year-month. Backups can be accessed via sftp :
$ sftp vps68271@backup
Connected to backup.
sftp> dir
SETEST-2016-06    SETEST-weekday-4
sftp> ls -l */*
-rw-r--r--    0 1120     1122       199611 Jun  1 20:52 SETEST-weekday-4/geoserver_data_init.tar.gz
-rw-r--r--    0 1120     1122        16345 Jun  2 00:00 SETEST-weekday-4/backup.log
-rw-r--r--    0 1120     1122       262846 Jun  2 16:39 SETEST-weekday-4/geoserver_data.tar.gz
-rw-r--r--    0 1120     1122          542 Jun  2 16:39 SETEST-weekday-4/postgres.sql.bz2
-rw-r--r--    0 1120     1122          308 Jun  2 16:39 SETEST-weekday-4/backup_db.log
-rw-r--r--    0 1120     1122        13570 Jun  2 16:39 SETEST-weekday-4/gis.sql.bz2
-rw-r--r--    0 1120     1122       199611 Jun  1 20:52 SETEST-2016-06/geoserver_data_init.tar.gz
-rw-r--r--    0 1120     1122        16345 Jun  2 00:00 SETEST-2016-06/backup.log
-rw-r--r--    0 1120     1122       262846 Jun  2 16:39 SETEST-2016-06/geoserver_data.tar.gz
-rw-r--r--    0 1120     1122          542 Jun  2 16:39 SETEST-2016-06/postgres.sql.bz2
-rw-r--r--    0 1120     1122          308 Jun  2 16:39 SETEST-2016-06/backup_db.log
-rw-r--r--    0 1120     1122        13570 Jun  2 16:39 SETEST-2016-06/gis.sql.bz2
Show quota with command: ssh vps68271@backup quota.
12.2. Restoring
To restore, when e.g. the /var/smartem dir is inadvertently deleted (as has happened once), the entire data and services can be restored in minutes. Only all logging info cannot be restored. Also handy when moving data to another server.
Latest nightly backups should be under /var/smartem/backup, in worser cases under the vps backup
(see above).
12.2.2. Restore Databases
PostGIS and InfluxDB can be restored as follows.
    # Be sure to have no dangling data (dangerous!)
    /bin/rm -rf /var/smartem/data/postgresql   # contains all PG data

    # Restart PostGIS: this recreates  /var/smartem/data/postgresql
    ~/git/services/postgis/run.sh

    # creeer database schema's globale vars etc
    cd ~/git/platform
    ./init-databases.sh

    # Restore PostGIS data for each PG DB schema
~/git/platform/restore-db.sh /var/smartem/backup/gis-smartem_rt.dmp
~/git/platform/restore-db.sh /var/smartem/backup/gis-smartem_refined.dmp
~/git/platform/restore-db.sh /var/smartem/backup/gis-smartem_calibrated.dmp
~/git/platform/restore-db.sh /var/smartem/backup/gis-smartem_extract.dmp
~/git/platform/restore-db.sh /var/smartem/backup/gis-smartem_harvest-rivm.dmp
~/git/platform/restore-db.sh /var/smartem/backup/gis-sos52n1.dmp
~/git/platform/restore-db.sh /var/smartem/backup/gis-smartem_raw.dmp    # big one

    # Restore InfluxDB data
cd /var/smartem/data
tar xzvf ../backup/influxdb_data.tar.gz
12.2.3. Restore Services
Services are restored as follows:
# Restore GeoServer data/config
cd /var/smartem/data
tar xzvf ../backup/geoserver_data.tar.gz

# Restore SOS 52North config
cd /var/smartem/data
tar xzvf ../backup/sos52n_data.tar.gz

# Restore Grafana  NOT REQUIRED (config from GitHub)
# cd /var/smartem/config
# tar xzvf ../backup/grafana_config.tar.gz

    # Grafana restore (tricky)
    rm -rf /var/smartem/config/grafana
    rm -rf /var/smartem/data/grafana
    rm -rf /var/smartem/log/grafana

    # run once
    cd ~/git/service/grafana
    ./run.sh

    # creates all grafana dirs

    # Stop and copy Grafana db (users, dashboards etc.)
    docker stop grafana
    docker rm grafana
    cp /var/smartem/backup/grafana.db  /var/smartem/data/grafana
    ./run.sh

    # Check restores via the viewers: smartApp, Heron and SOS Viewer
12.2.4. Restore Calibration Images
Calibration Images can be restored as follows.
cd /opt/geonovum/smartem/git/etl
tar xzvf /var/smartem/backup/calibration_images.tar.gz
12.3. ETL and Data Management
12.3.1. Republish Data to SOS and STA
In cases where for example calibration has changed, we need to republish all (refined) data to the SOS and STA. This is not required for data in GeoServer since it directly uses the Refined DB tables. SOS and STA keep their own (PostGIS) databases, hence these must be refilled.
Below the steps to republish to SOS and STA, many are common. This should be performed on SE TEST Server:
    # stop entire platform: services and cronjobs
service smartem stop

# Start PostGIS
cd ~/git/services/postgis
./run.sh
Next do STA and/or SOS specific initializations.
12.3.1.1. SensorUp STA Specific
This is specific to STA server from SensorUp.
    # use screen as processes may take long
    screen -S sta

# STA clear data
cd ~/git/database
./staclear.sh

# if this does not work re-init on server
login at sta.smartemission.nl
service tomcat8 stop
su - postgres
cat db-sensorthings-init.sql | psql sensorthings
service tomcat8 start
logout

    # STA Publisher: restart
    ./sta-publisher-init.sh

    # STA Test if publishing works again
    cd ~/git/etl
    ./stapublisher.sh

    # If ok, reconfigure stapublisher such that it runs forever
    # until no more refined data avail
    # edit stapublisher.cfg such that 'read_once' is False
    # [input_refined_ts_db]
    # class = smartemdb.RefinedDbInput
    # .
    # .
    # read_once = False

    # Now run stapublisher again (will take many hours...)
    ./stapublisher.sh

    # Detach screen
    control-A D
12.3.1.2. 52North SOS Specific
This is specific to SOS server from 52North.
# Start SOS
cd ~/git/services/sos52n
./run.sh

# SOS clear DB and other data
cd ~/git/services/sos52n/config
./sos-clear.sh

    # SOS Publisher: restart
cd ~/git/database/util
    ./sos-publisher-init.sh

    # SOS Test if publishing works again
    cd ~/git/etl
    ./sospublisher.sh

    # If ok, reconfigure sospublisher such that it runs forever
    # until no more refined data avail
    # edit sospublisher.cfg such that 'read_once' is False
    # [input_refined_ts_db]
    # class = smartemdb.RefinedDbInput
    # .
    # .
    # read_once = False

    # use screen as processes may take long
    screen -S sos

    # Now run sospublisher again (will take many hours...)
    ./sospublisher.sh

    # Detach screen
    control-A D
All dynamic data can be found under /var/smartem/data.
12.3.2. Calibration Model
This needs to be intalled from time to time on the production server. Two parts are incolved: database schema (the model) and images (the results/stats).
All can be restored as follows, assuming we have the data in some backup.
    ~/git/platform/restore-db.sh gis-smartem_calibrated.dmp
cd /opt/geonovum/smartem/git/etl
tar xzvf calibration_images.tar.gz
12.4. Admin UI
There is a simple password-protected admin UI for several tasks and inpections. The Admin URL can be found via the “Links” entry SE Platform website (<data|test>.smartemission.nl).
Via a main screen admin tasks and inpections are selected.
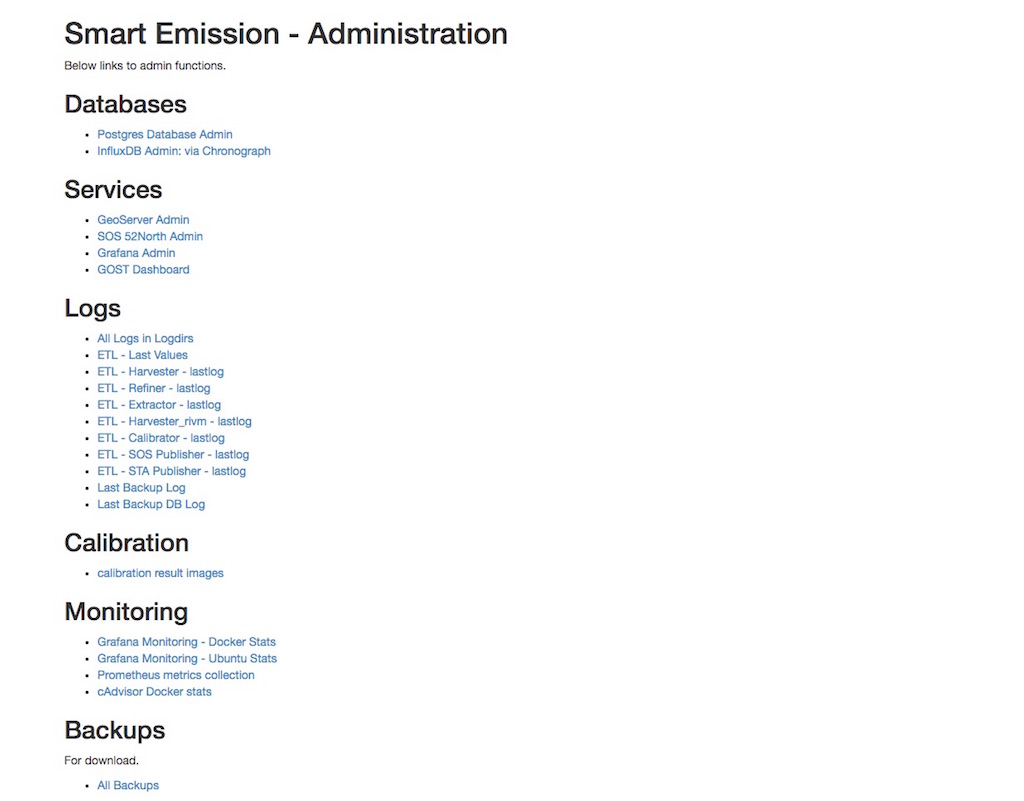
Figure - SE Admin Page Main Screen
12.4.1. Database Management
Management of Postgres/PostGIS DB data is provided via phppgadmin.
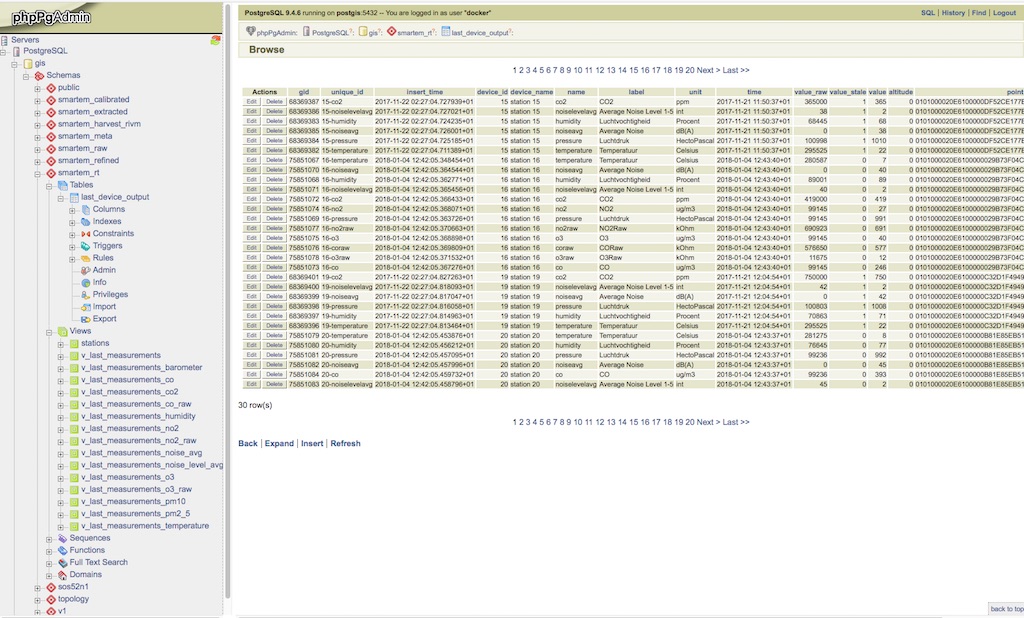
Figure - Postgres DB Management via phppgadmin
Management of InfluxDB data is provided via Chronograf.
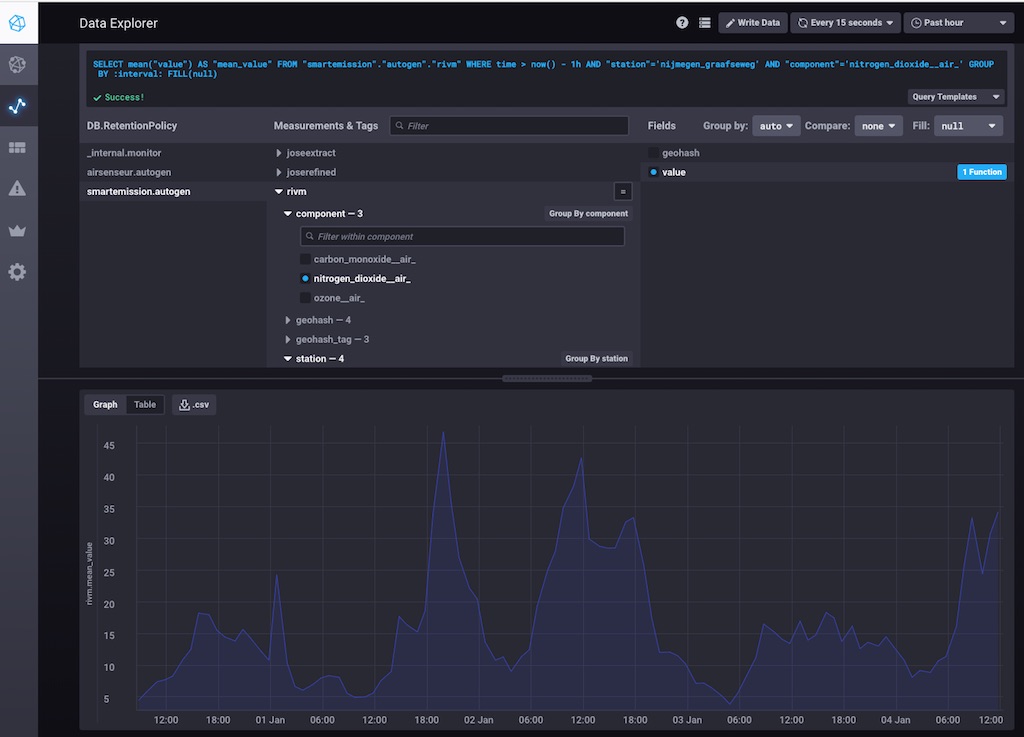
Figure - InfluxDB Management via Chronograf
Also possibility to develop dashboards.
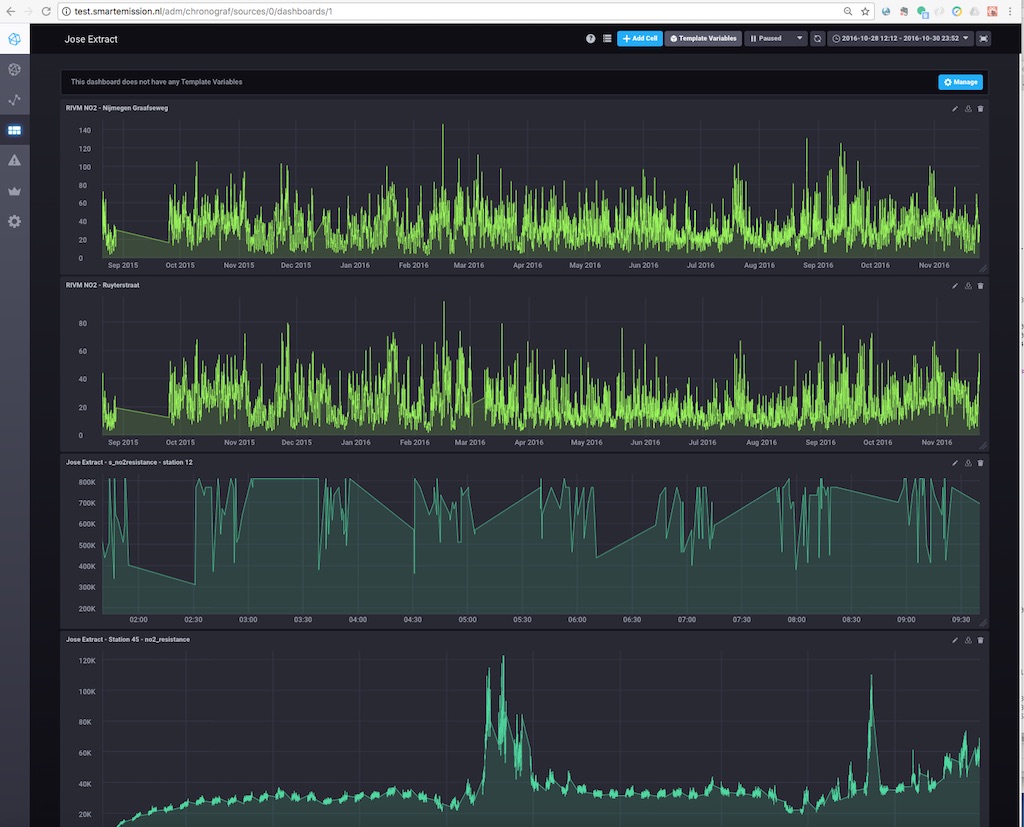
Figure - InfluxDB Management Dashboards in Chronograf
12.4.2. Services Management
Most of the application servers provide their own management web UI. These can be invoked from the admin page as well, for example:
- GeoServer Admin
- SOS 52North Admin
- Grafana Admin
- SensorThings API (via GOST) Dashboard
12.4.3. Log Inspection
All log files for the ETL and for the application services can be accessed via the admin screen.
12.5. Monitoring
Local monitoring tools are invoked from the admin screen (see above).
12.5.1. Services Uptime
All SE API services (WMS, WFS, SOS, STA etc) and external APIs (Whale Server, Intemo Harvester) are monitored via UptimeRobot.com. Notification of downtime os via email or SMS.
12.5.2. Systems Monitoring
All systems (Ubuntu OS, Docker etc) are monitored using Prometheus with Exporters and Grafana.
Prometheus collects and stores data as timeseries by pulling metrics from Exporters. An Exporter collects local metric data and exposes these via a uniform HTTP API through which Prometheus pulls. Each Exporter is resource-specific: e.g. a Node Exporter collects metrics from a Linux OS. Google cAdvisor will be used to collect and expose Docker metrics.
Grafana uses Prometheus as a Data source, providing various standard Dashboards for visualization. Also Alerting can be configured via Prometheus, using the AlertManager to send to various alerting destinations (email, SMS, webhook etc).
A complete setup for the above can be found at https://github.com/vegasbrianc/prometheus. This is used as a base for SE monitoring. Grafana monitoring Dashboards can be accessed via the SE Admin UI.
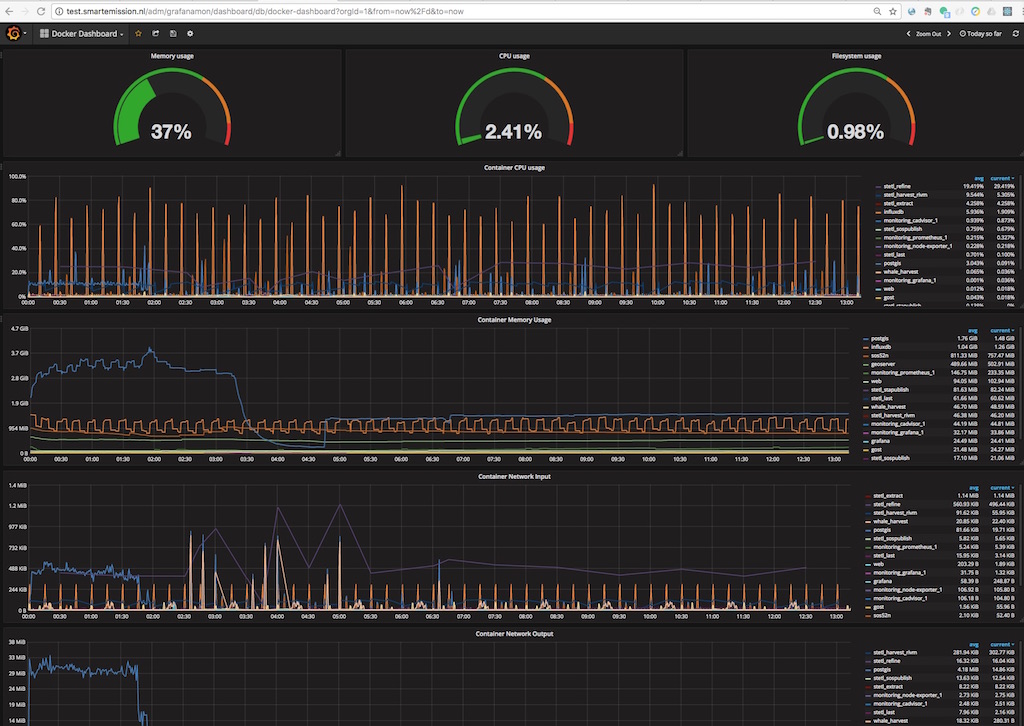
Figure - Docker Monitoring in SE
12.6. Troubleshooting
Various issues found and their solutions.
12.6.1. Docker won’t start
This may happen after a Ubuntu (kernel) upgrade. In syslog “[graphdriver] prior storage driver “aufs” failed: driver not supported”.
- Solution: https://github.com/docker/docker/issues/14026 : Remove dir
/var/lib/docker/aufs.