2. Architecture
This chapter describes the (software) architecture of the Smart Emission Data (Distribution) Platform. A recent presentation (PDF) and this paper also may give more insight.
2.1. Global Architecture
This section sketches “the big picture”: how the Smart Emission Data Platform fits into an overall/global architecture from sensor to citizen as depicted in Figure 1a and 1b below.
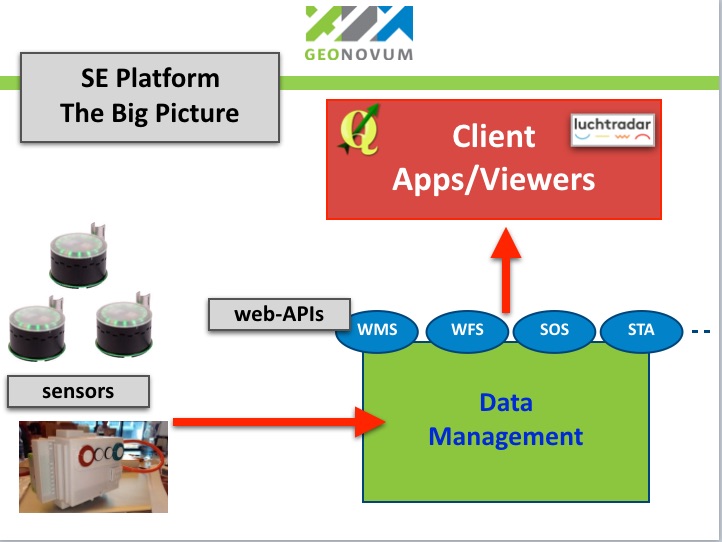
Figure 1a - Smart Emission Architecture - The Big Picture
Figure 1a shows the main flow of data (red arrows) from sensors to viewers, in the following steps:
- Data is collected by sensors and sent to Data Management
- Data Management (ETL) is responsible for refining raw sensor data
- This refined (validated, calibrated, aggregated) sensor data is made available via Web Services
- Web Services include standardized OCG Web APIs like WMS (Time), WFS, SOS and the SensorThings API (STA)
- Viewers like the
SmartAppandHeronand other clients use these Web APIs to fetch sensor (meta)data
Figure 1b expands on this architecture showing additional components and dataflows:
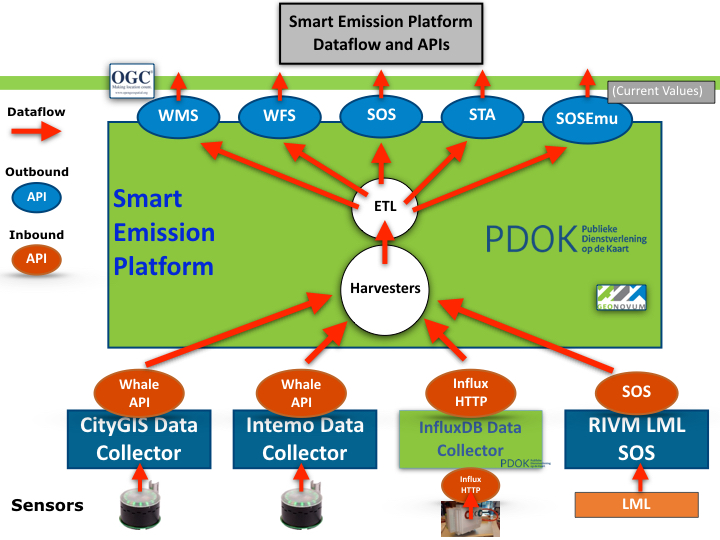
Figure 1b - Smart Emission Architecture - Expanded with Dataflows
In Figure 1b the following is shown:
- Sensor stations (sensors) send (push) their raw data to Data Collectors
- A Data Collector functions as a buffer, keeping all data history using efficient bulk storage (InfluxDB, MongoDB, SOS)
- A Data Collector can be extern (blue) or internal (green) to the SE Data Platform
- A Data Collector provides an Web API through which its data (history) can be Harvested (pulled)
- The SE Data Platform continuously harvests all sensor data from Data Collectors (push/pull decoupling)
- A set of ETL (Extract, Transform, Load) components refines/aggregates the raw sensor data, making it available via web service APIs
- SOS LML harvesting is used for acquiring reference data for Calibration only
Some details for the Intemo Josene: The sensor installation is connected to a power supply and to the Internet. Internet connection is made by WIFI or telecommunication network (using a GSM chip). The data streams are sent encrypted to a Data Collector (see above). The encrypted data is decrypted by a dedicated “Jose Input Service” that also inserts the data streams into a MongoDB or InfluxDB database using JSON. This database is the source production database where all raw sensor data streams of the Jose Sensor installation are stored. A dedicated REST API – the Raw Sensor API nicknamed the Whale API - is developed by CityGIS and Geonovum for further distribution of the SE data to other platforms.
In order to store the relevant SE data in the distribution database harvesting and pre-processing of the raw sensor data (from the CityGIS and Intemo Data Collectors) is performed. First, every N minutes a harvesting mechanism collects sensor-data from the Data Collectors using the Raw Sensor API. The data encoded in JSON is then processed by a multi-step ETL-based pre-processing mechanism. In several steps the data streams are transformed to the Postgres/PostGIS database. For instance, pre-processing is done specifically for the raw data from the air quality sensors. Based on a calibration activity in de SE project, the raw data from the air quality sensors is transformed to ‘better interpretable’ values. Post-processing is the activity to transform the pre-processed values into new types of data using statistics (aggregations), spatial interpolations, etc..
The design of the Smart Emission Data Platform, mainly the ETL design, is further expanded below.
2.2. Data Platform Architecture
Figure 2 below sketches the overall architecture with an emphasis on the flow of data (arrows). Circles depict harvesting/ETL processes. Server-instances are in rectangles. Datastores the “DB”-cons.
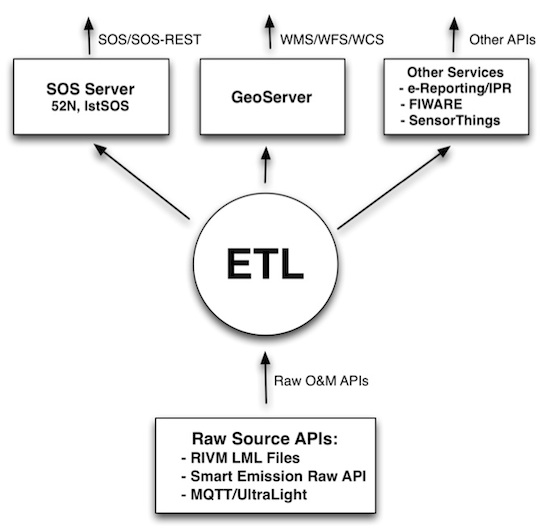
Figure 2 - Smart Emission Data Platform ETL Context
This global architecture is elaborated in more detail below. Figure 3 sketches a multistep-ETL approach as used within the SOSPilot project. Here Dutch Open Air Quality Data provided through web services by RIVM (LML) was gathered and offered via OGC SOS and W*S services in three steps: Harvesting, Preprocessing and Publishing, the latter e.g. via SOS-T(ransactional). The main difference/extension to RIVM LML ETL processing is that the Smart Emission raw O&M data is not yet validated (e.g. has outliers), calibrated and aggregated (e.g. no hourly averages). Also we need to cater for publication to the Sensor Things API Server (STA GOST)).
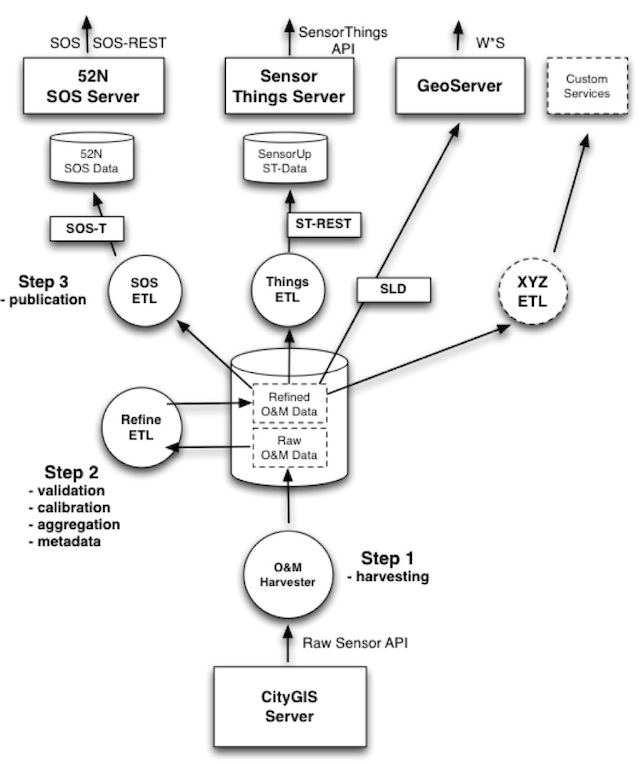
Figure 3 - Smart Emission Data Platform ETL Details
The ETL design comprises these main processing steps:
- Step 1: Harvester: fetch raw O&M data from the CityGIS server via the Raw Sensor API
- Step 2: Refiner: validate, calibrate and aggregate the Raw O&M Data, rendering Refined O&M Data with metadata. The datastore is Postgres with PostGIS.
- Step 3: Publisher. Publish to various services, some having internal (PostGIS) datastores.
The services to be published to are:
- SOS ETL: transform and publish to the 52N SOS DB via SOS-Transactional (SOS-T)
- Things ETL: transform and publish to the Geodan GOST SensorThings API (STA, via REST)
- Publication via GeoServer WMS (needs SLDs) and WFS directly
- XYZ: any other ETL, e.g. providing bulk download as CSV
Some more notes for the above dataflows:
- The central DB will be Postgres with PostGIS enabled
- Refined O&M data can be directly used for OWS (WMS/WFS) services via GeoServer (using SLDs and a PostGIS datastore with selection VIEWs, e.g. last values of component X)
- The SOS ETL process transforms refined O&M data to SOS Observations and publishes these via the SOS-T InsertObservation service. Stations are published once via the InsertSensor service.
- Publication to the GOST SensorThings Server goes via the STA REST service
- These three ETL steps run continuously (via Linux cronjobs)
- Each ETL-process applies “progress-tracking” by maintaining persistent checkpoint data. Consequently a process always knows where to resume, even after its (cron)job has been stopped or canceled. All processes can even be replayed from time zero.
2.3. Deployment
Docker is the main building block for the SE Data Platform deployment architecture.
Docker …allows you to package an application with all of its dependencies into a standardized unit for software development.. Read more on https://docs.docker.com.
The details of Docker are not discussed here, there are ample sources on the web. One of the best, if not the best, introductory books on Docker is The Docker Book.
The SE Platform can be completely deployed using either Docker Compose or using Docker Kubernetes (K8s, abbreviated). The platform hosted via PDOK is using K8s.
2.3.1. Docker Strategy
Components from the Smart Emission Data Platform as described in the architecture above are deployed using Docker. Docker is a common computing container technology also used extensively within Dutch Kadaster. By using Docker we can create reusable high-level components, “Containers”, that can be built and run within multiple contexts. Figure 4 sketches the Docker deployment. The entities denote Docker Containers, the arrows linking. Like in Object Oriented Design there are still various strategies and patterns to follow with Docker. There is a myriad of choices how to define Docker Images, configure and run Containers etc. Within the SE Platform the following strategies are followed:
- define generic/reusable Docker Images,
- let each Docker image perform a single (server) task: Apache2, GeoServer, PostGIS, 52NSOS etc.
- all in all this forms a Microservices Architecture
The Docker Containers as sketched in Figure 4 are deployed.
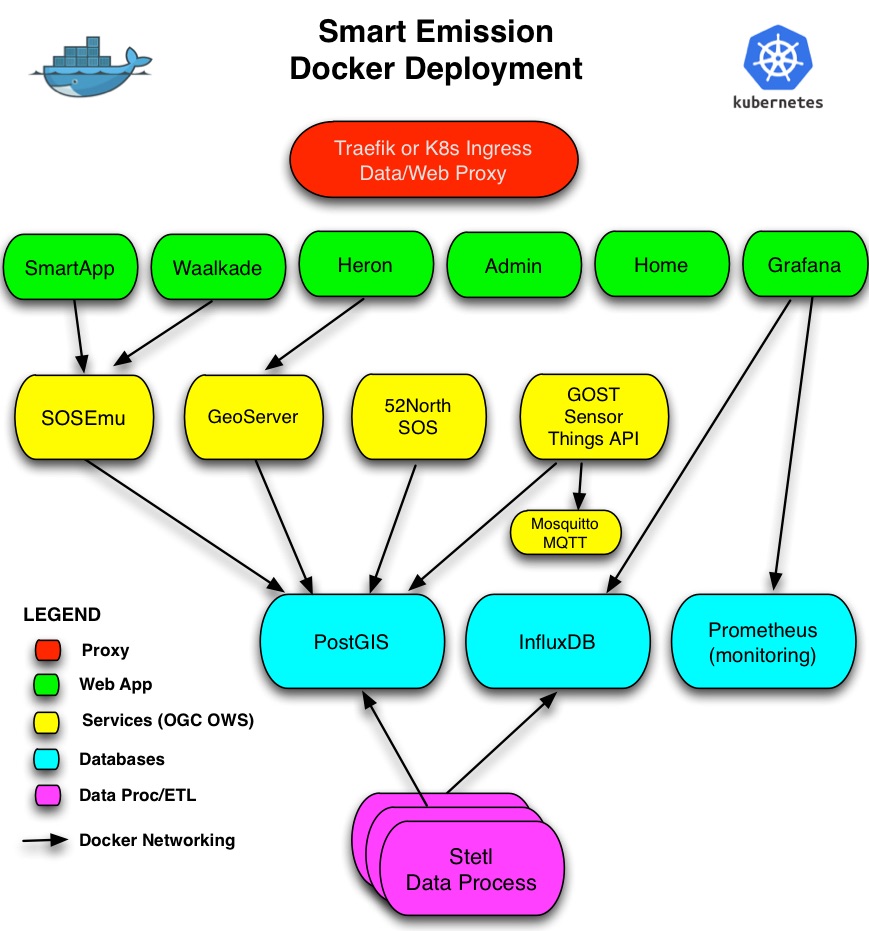
Figure 4 - Docker Deployment - Container View
Docker Containers will be created/used for:
Webfront-end (Apache2) webserving (viewers/apps) and proxy to backend web-APIsGeoServer: container with Tomcat running GeoServer52North_SOS: container with Tomcat running 52North SOSSensorThings API: container running Geodan GOST SensorThings API ServerStetl: container for the Python-based ETL framework usedPostGIS: container running PostgreSQL with PostGIS extensionInfluxDB: container running InfluxDB server from InfluxDataChronograf: container running Chronograf (InfluxDB Admin) from InfluxDataGrafana: container running Grafana DashboardMQTT: container running Mosquitto MQTT
The Docker Networking capabilities of Docker will be applied to link Docker Containers, for example to link GeoServer and the other application servers to PostGIS. Docker Networking may be even applied (VM-) location independent, thus when required Containers may be distributed over VM-instances. Initially all data, logging, configuration and custom code/(web)content was maintained Local, i.e. on the host, outside Docker Containers/images. This will made the Docker Containers less reusable. Later, during PDOK migration, most Docker Images were made self-contained as much as possible.
An Administrative Docker Component is also present. Code, content and configuration is maintained/synced in/with GitHub (see below). Docker Images are available publicly via Docker Hub.
The list of Docker-based components is available in the Components chapter.
See https://github.com/smartemission for the generic Docker images.
2.3.2. Test and Production
In order to provide a continuous/uninterrupted service both a Test and Production deployment has been setup. For local development on PC/Mac/Linux a Vagrant environment with Docker can be setup.
The Test and Production environments have separate IP-adresses and domains: test.smartemission.nl and data.smartemission.nl respectively.
2.3.3. Monitoring
The challenge is to monitor services contained in Docker.
Monitoring is based around Prometheus and a dedicated (for monitoring) Grafana instance. A complete monitoring stack is deployed via docker-compose based on the Docker Monitoring Project. In the future this approach by Stefan Prodan is worthwhile.
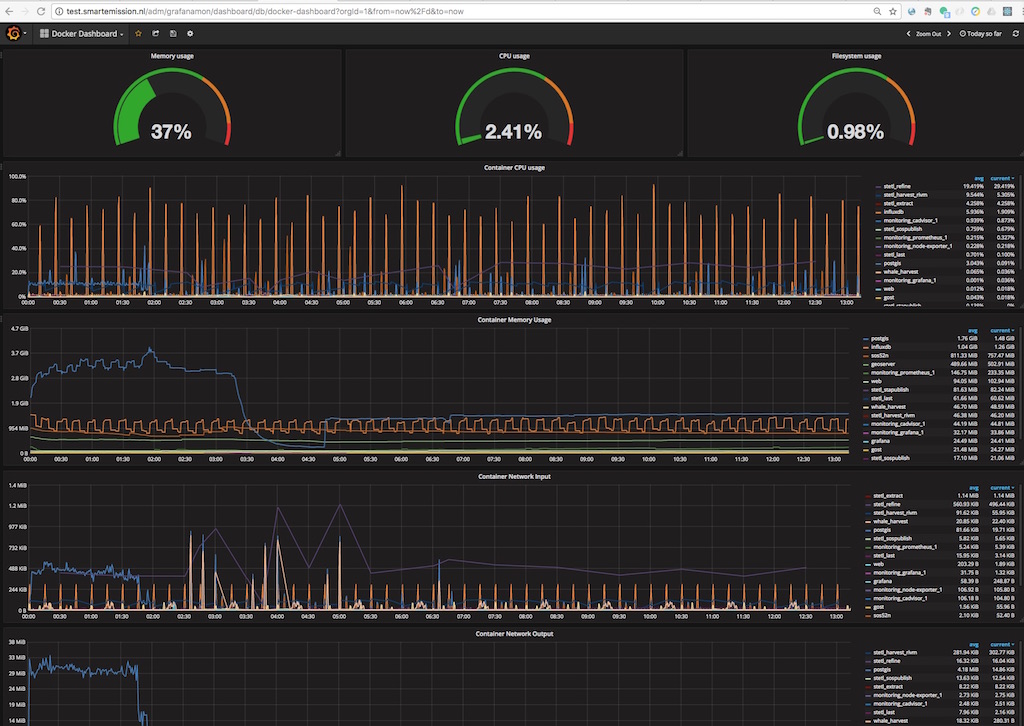
Figure 5 - Docker Monitoring in SE